(GAUSSIAN)
A normal distribution has a bell-shaped density curve described by its mean
centered about its mean, with its spread determined by its standard deviation.
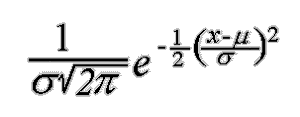
The height of a normal density curve at a given point x is given by

 The Standard
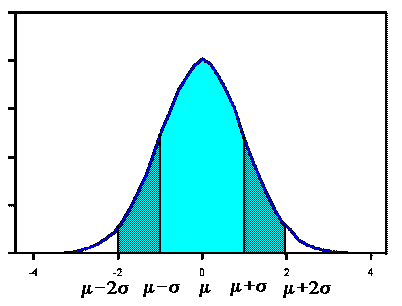
Normal curve, shown here, has mean 0 and standard deviation 1. If a dataset follows
a normal distribution, then about 68% of the observations will fall
within ![]()
of the mean ![]() , which in this case is with
, which in this case is with
the interval (-1,1). About 95% of the observations will fall within 2 standard deviations
of the mean, which is the interval (-2,2) for the standard normal, and about 99.7%
of the observations will fall within 3 standard deviations of the mean, which
corresponds to the interval (-3,3) in this case. Although it may appear as if a
normal distribution does not include any values beyond a certain interval, the density
is actually positive for all values,  .
.
Data from any normal distribution may be transformed into data following the standard normal
distribution by subtracting the mean ![]() and dividing
and dividing
by the standard deviation ![]() .
.
No comments:
Post a Comment